Systems and Networks
Before you can use Radio Mobile to plot RF performance you need to set up networks and the systems within those networks. Depending on how you plan on using Radio Mobile you may only need a single network with a single system or you may need several different networks with many different systems.
First you should determine how you want to organize your networks and systems. For the purpose of this HowTo I will use a single network using the license free 802.11b frequencies and a couple of sample systems used later for creating RF plots.
Click on the File menu and select "Networks Properties." This will bring up the Networks Properties dialog as shown in Figure 16.
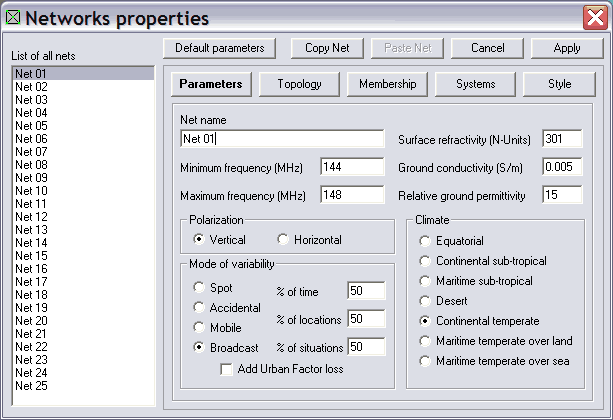
Figure 16: Networks Properties
By default Net 01 should be selected. Change this to 802.11b in the Net name field. The Minimum frequency needs to be changed to 2412 (channel 1) and Maximum frequency to 2462. Make sure you do not enter the frequencies in GHz or your plots will be wildly inaccurate. The rest of the defaults are fine for this example although checking "Add Urban Factor loss" makes plots a bit more accurate as it compensates a bit for terrain.

Figure 17: A Sample 802.11b network
Now click on the Systems button. You should see a window similar to Figure 18.
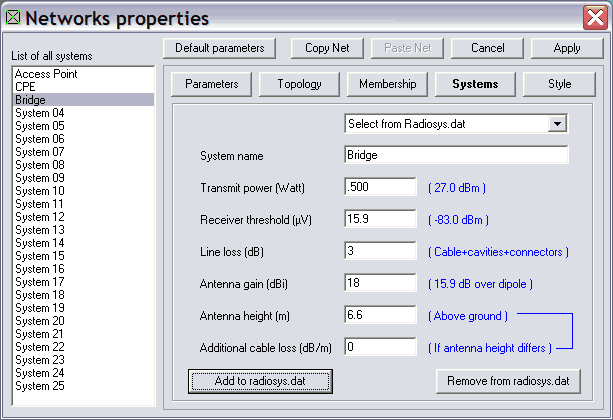
Figure 18: Sample systems
You can download the radiosys.dat file used in these examples here. Copy this file to your Radio Mobile directory and you should see three systems and the sample network when you start the program again. The figures you see in the various fields are based on equipment available from Young Design, Inc. based in Fall Church, VA. They specialize in license-exempt wireless equipment (yes, this is a bit of a plug, they're great people to work with.) Antenna heights for the CPE and Bridge systems are set at 20 feet (6.6m) and the Access Point antenna height is set to 49 feet (15m.) Cable loss is calculate using Times Microwave LMR-400. Antenna gains are based on a 12dBi omni for the Access Point, a 24dBi grid dish for the CPE and an 18dBi patch for the bridge. Again, these are only examples for demonstration purposes.
If you feel you have a good understanding of how to set up networks and systems continue on to the next section, RF Coverage Plot, where you will create a sample RF coverage plot using the sample data.
Copyright (c)2003 Greg
A. Bur
Permission is granted to copy, distribute and/or modify this document
under the terms of the GNU Free Documentation License, Version 1.2
or any later version published by the Free Software Foundation;
with no Invariant Sections, no Front-Cover Texts, and no Back-Cover Texts.
A copy of the license is included in the section entitled "GNU
Free Documentation License".